Understanding Heatmaps
Heatmaps are a graphical representation of data where values in a matrix are represented as colors. They are commonly used to visualize complex data sets such as website traffic, sales performance, and weather patterns.
-
Website Traffic: A heatmap can show which areas of a website are getting the most clicks. For example, the homepage may have a lot of activity represented by a warm color, while less popular pages are cooler in color.
-
Sales Performance: In e-commerce, a heatmap can display which products are most frequently purchased. Popular items will be highlighted with vibrant colors, making it easy to identify trends.
-
Weather Patterns: Meteorologists use heatmaps to illustrate temperature variations across regions. Warmer areas are shown in red, while cooler areas are displayed in blue or green.
Types of Heatmaps
Intensity Heatmap
An intensity heatmap represents the intensity of a variable across different categories. For example, a heatmap showing the sales performance of products in different regions.
Correlation Heatmap
A correlation heatmap displays the correlation between variables in a dataset. For instance, a heatmap showing the correlation between different factors affecting stock prices.
Hierarchical Heatmap
A hierarchical heatmap arranges rows and columns based on their similarity, usually using clustering techniques. An example could be a heatmap showing the genetic similarities between different species.
Geospatial Heatmap
A geospatial heatmap visualizes data on a map, showing the concentration of data points in specific geographic locations. A common example is a heatmap showing population density in different regions.
Benefits of Heatmap Analysis

1. Visual Representation
Heatmap analysis provides a visual representation of data, making it easier to identify patterns and trends. For example, a heatmap can show which areas of a website receive the most clicks.
2. Data Comparison
Heatmaps allow for easy comparison of data sets. By using color gradients, you can quickly see differences in values. An example could be comparing sales performance across different regions.
3. User Behavior Insights
Heatmaps can offer valuable insights into user behavior. For instance, a scroll heatmap can reveal how far down a page users typically read, helping to optimize content placement.
4. Decision Making Support
Heatmap analysis can support decision-making processes by providing data-driven evidence. For example, heatmaps can help in deciding the placement of call-to-action buttons based on where users most frequently click.
5. Improved User Experience
By analyzing heatmaps, businesses can enhance user experience. For instance, identifying areas where users tend to drop off can lead to adjustments that increase engagement and conversions.
Interpreting Heatmap Data
Heatmap Data:
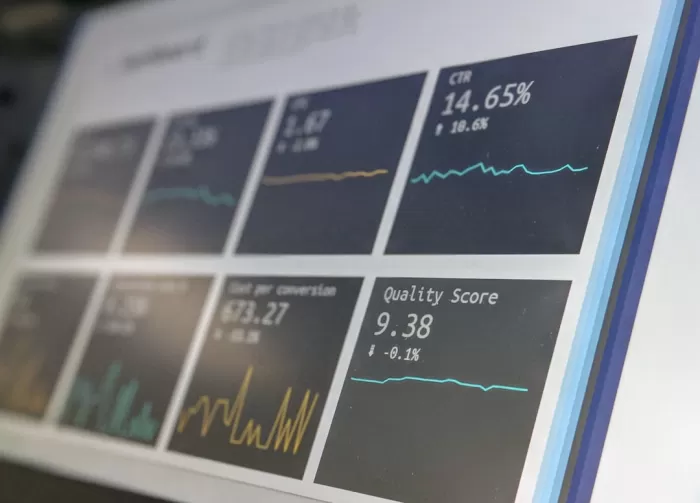
Heatmap data is a visual representation of data where values are depicted by colors. This type of graph is useful for quickly identifying patterns and trends in large datasets.
Interpreting Heatmap Data:
Let's say we have a heatmap displaying sales data for a retail store. In this heatmap, different colors represent different sales volumes. By looking at the heatmap, we can easily spot which products are selling well (indicated by darker colors) and which ones are not performing as expected (lighter colors).
Using Heatmaps:
- Identifying trends: Heatmaps allow us to identify trends such as seasonal variations in sales or customer behavior.
- Comparing data: We can compare different segments of data to see how they perform relative to each other.
- Detecting outliers: Heatmaps can help us identify outliers or anomalies in the data that require further investigation.
Implementing Changes Based on Heatmap Insights

After analyzing the heatmap data, we have identified key areas for improvement on our website:
1. Call-to-Action Buttons:
- Heatmap data shows that the "Buy Now" button on the homepage is not prominent enough.
- We will be increasing the size and changing the color to make it more visually appealing.
2. Navigation Menu:
- Users seem to be confused by the current navigation menu structure.
- We will simplify the menu by grouping related items together for easier navigation.
3. Product Images:
- Heatmap data indicates that users are not engaging with certain product images.
- We will be updating these images to be more enticing and informative.
A/B Testing for Validation
-
What is A/B testing?
A/B testing is a method used to compare two versions of a webpage or app against each other to determine which one performs better. For example, you can test two different call-to-action buttons to see which one leads to more conversions.
-
How does A/B testing work?
In A/B testing, users are randomly shown either version A or version B of a webpage. Their interactions and behaviors are then tracked and analyzed to determine which version is more effective in achieving the desired outcome. For instance, if you are testing two different headlines, you can see which one results in higher click-through rates.
-
Why is A/B testing important for validation?
A/B testing is crucial for validation because it allows you to make data-driven decisions based on user behavior rather than personal opinions or assumptions. By testing different variations, you can validate which design, copy, or feature resonates best with your audience.
Monitoring User Behavior
Understanding user behavior is crucial for any website or application.
By monitoring how users interact with your site, you can gain valuable insights that can help improve user experience and drive conversions.
For example:
- Tracking which pages users visit the most can help you optimize content placement.
- Monitoring the time spent on each page can indicate engaging content versus areas that may need improvement.
- Examining user click patterns can reveal navigation issues that could be hindering the user experience.
Overall, monitoring user behavior allows you to make data-driven decisions to enhance your website or application.
Continuous Improvement Strategies

Continuous Improvement Strategies
-
Implementing Kaizen:
For example, at Company XYZ, employees are encouraged to submit improvement suggestions regularly to enhance processes and efficiency.
-
Utilizing Lean Principles:
One way to apply lean principles is by reducing waste in production. An example is Toyota's famous practice of just-in-time inventory.
-
Applying Six Sigma:
At Company ABC, Six Sigma methodologies are used to identify and eliminate defects in the manufacturing process, leading to higher quality products.


